Statistical Methods with R
Power Analysis
Unit E · Chapter 14 · Lecture 14a
Developed by Jeffrey M. Girard

Power Analysis
Power analysis
- Power is the probability of correctly rejecting the null hypothesis (given that it is false)
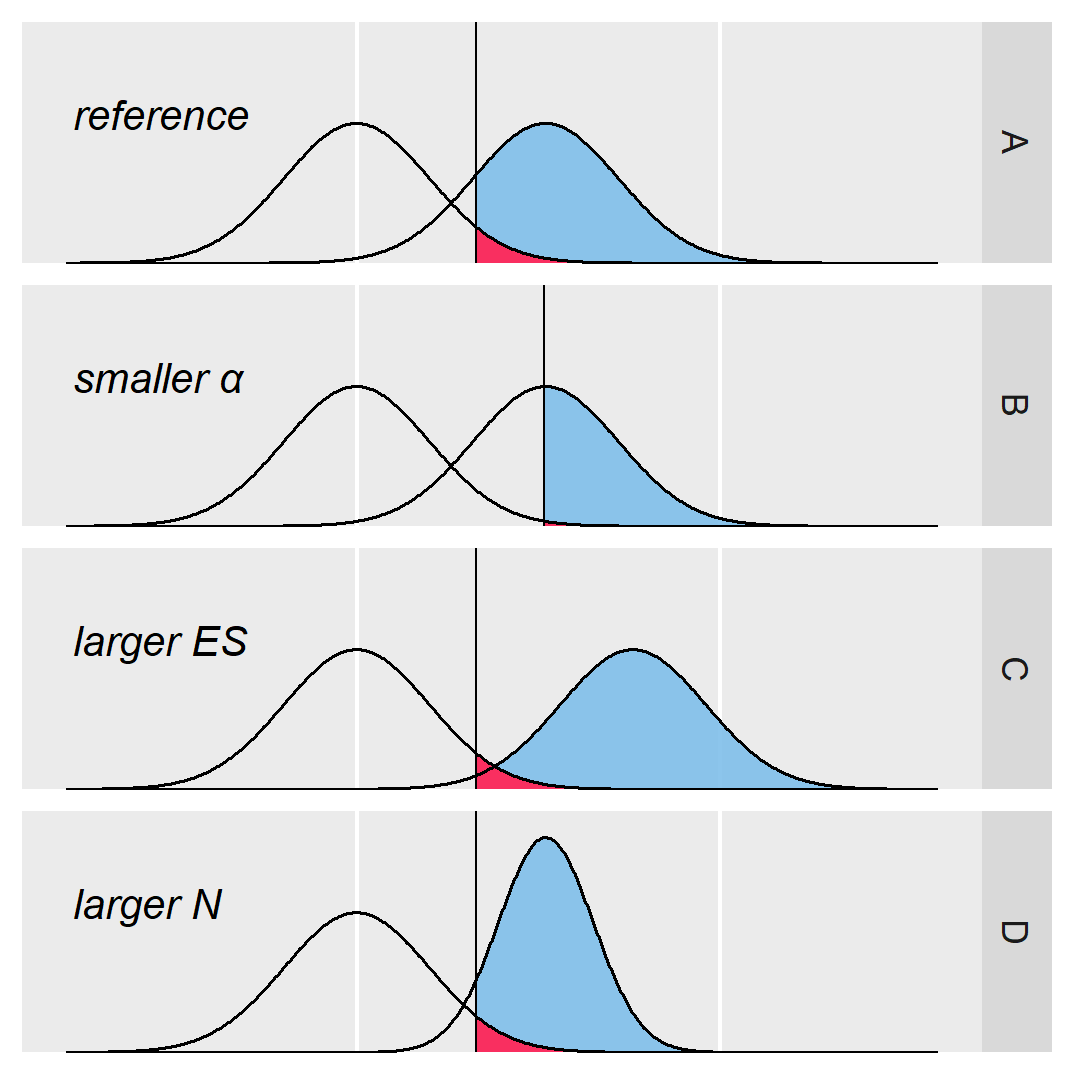
- Power is closely related to
the effect size, n, and \alpha - These quantities are so related that we can estimate any one from the other three
- Power analysis is doing these kind of calculations
- Power is closely related to
Blue = power, red = Type I error rate (α), line = decision criterion
Types of power analysis
- A priori: determine n given others
- Useful for planning before a new data collection (primary use)
- Sensitivity: determine minimum \text{ES} given others
- Useful when you are unsure of the effect size to expect
- Post-hoc: determine power (1-\beta) given others
- Not very useful in practice (since your \text{ES} is based on the data)
- Criterion: determine \alpha given others
- Not very useful in practice (since \alpha is usually fixed anyway)
Power analysis techniques
- Analytical power analysis
- Solve using equations (easier but less flexible)
- e.g., the G*Power program, the {WebPower} package
- Simulation-based power analysis
- Solve using simulated data (harder but more flexible)
- e.g., the Mplus program, the {simr} package
t-test power
- A t-test compares the means of two groups (independent or paired)
- To do a priori power analysis, we need an expected effect size
- The effect size that WebPower wants you to provide is Cohen’s d
d=\frac{\bar{x}_2 - \bar{x}_1}{s}
- Best Approach: estimate d from previous studies
- Last Resort: plan to detect a “small” effect (d=0.2)
Example 1
What sample size would provide 80% power to detect an effect of size d=0.3 when comparing two independent groups?
We need 176 participants per group (352 total); always round up
Example 2
Now, what sample size would provide 80% power to detect an effect of size d=0.5 when comparing two independent groups?
We need fewer participants to detect a larger (more obvious) effect
Example 3
Now, what sample size would provide 80% power to detect an effect of size d=0.5 when comparing two dependent groups?
We need fewer participants when each provides repeated measures
Careful: the paired d is defined on the difference scores, so it is not interchangeable with the two-sample d
One-way ANOVA power
- One-way ANOVA compares the means of multiple groups
- WebPower wants f and k (the number of groups)
f=\frac{\sigma_b}{\sigma_w}
- Best Approach: estimate f from previous studies
- Last Resort: plan to detect a “small” effect (f=0.10)
Check out wp.rmanova() for repeated measured ANOVA power analysis
Example 1
What sample size would provide 80% power to detect an effect of size f=0.25 when comparing 4 independent groups?
We need 180 participants total (45 per group), rounding 178.4 up to a whole number per group
Example 2
What sample size would provide 80% power to detect an effect of size f=0.25 when comparing 5 independent groups?
With more groups, we need fewer participants per group (40, rounding up 39.2)
Linear model power
- We technically have two types of power for LM
- Both will compare the R^2 values of “full” and “reduced” models
- Omnibus power (of the overall model’s F test)
- Full model: Includes all predictors
- Reduced model: Excludes all predictors
- Targeted power (of specific slopes’ t tests)
- Full model: Includes all predictors
- Reduced model: Excludes the targeted predictor(s)
Linear model power
- We will use the R^2 values to calculate the f^2 effect size
f^2=\frac{R_{\text{full}}^2 - R_{\text{reduced}}^2}{1-R_{\text{full}}^2}
Last Resort: plan to detect a “small” effect (f^2=.02)
WebPower also needs the number of predictors in each model
- p_1 is the number of predictors in the full model
- p_2 is the number of predictors in the reduced model
Omnibus example 1
What sample size would provide 80% power to explain 10% of the variance in the outcome variable using 5 predictor variables?
- First, let’s calculate f^2 from the specified information
- Full model has all predictors, so p_1=5 and R^2_{\text{full}}=0.10
- Reduced model has no predictors, so p_2=0 and R^2_{\text{red}}=0.0
Omnibus example 1
Now we can calculate the sample size needed in our example
We would need 122 total participants (rounding up 121.2)
Omnibus example 2
Now, what sample size would provide 80% power to explain 10% of the variance in the outcome variable using 7 predictor variables?
- First, let’s calculate f^2 from the specified information
- Full model has all predictors, so p_1=7 and R^2_{\text{full}}=0.10
- Reduced model has no predictors, so p_2=0 and R^2_{\text{red}}=0.0
Omnibus example 2
Now we can calculate the sample size needed in our example
More predictors need a larger sample (at the same f^2)
Targeted example 1
If sex and age explain 20% of the variance in our outcome variable, what sample size would provide 80% power to detect the effect of a third predictor that explains an additional 5%?
- Full model has three predictors, so p_1=3 and R^2_{\text{full}}=0.25
- Reduced model has two predictors, so p_2=2 and R^2_{\text{red}}=0.20
Targeted example 1
Now we can calculate the sample size needed in our example
We need 120 total participants (rounding up 119.1)
Targeted example 2
In the same example as the last one, what would change if sex and age had explained 40% of the variance instead of only 20%?
- Full model has three predictors, so p_1=3 and R^2_{\text{full}}=0.45
- Reduced model has two predictors, so p_2=2 and R^2_{\text{red}}=0.40
Targeted example 2
Now we can calculate the sample size needed in our example
More variance explained means fewer participants