Lecture 05b Assignment
Unit B · Chapter 05

Instructions
Create a new Quarto document (HTML format), clear out the boilerplate code/text, and use this document to store your answers to each of the three questions below. Be sure to enable embed-resources using the header below. If your answer involves writing text, then use markdown to write 2–4 sentences per question; if you answer involves running code, then use one or more code chunks.
---
title: "Lecture 05b Assignment"
author: "Your Name"
format: html
embed-resources: true
---
Please clearly mark which part of your document is answering which question (e.g., using markdown headings) and remove any “scratch work” or failed attempts from your document before submitting it. Finally, note that many essay-style questions will require you to read between the lines and use your imagination (as opposed to just looking up the answer in the lecture).
Question 1 (Correlation Theory)
What does it mean for two variables to be positively or negatively correlated with one another? What does it mean for two variables to have a correlation close to zero?
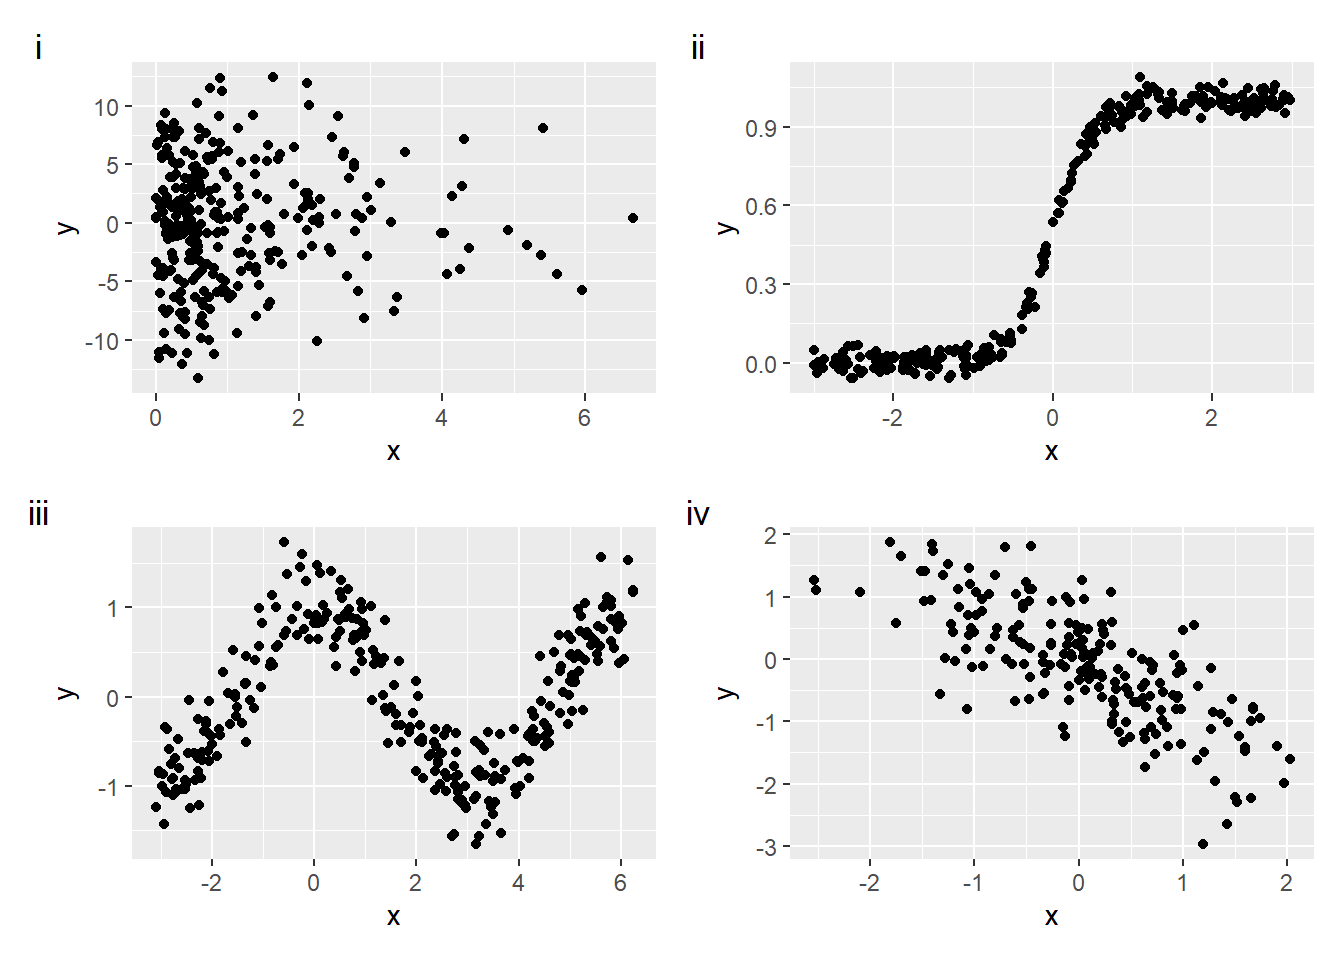
Look at the following scatterplots and indicate whether you think the Pearson correlation for each would be positive, negative, or close to zero. Also indicate whether you think each relationship depicted is linear, nonlinear, or none.
Question 2 (Calculating Correlations)
Download and read in the factbook1M.csv dataset, which contains information from the CIA’s World Factbook about all countries with more than 1 million people.
Calculate the covariance and the correlation between life expectancy (
life_exp) and birth rate (birth_rate).The covariance and the correlation describe the same relationship but are not equally easy to interpret. Explain what the correlation tells you that the covariance does not.
Question 3 (Statistical Inference)
Read in the factbook1M dataset again for this question so that it can be answered on its own.
Test whether the correlation between
life_expandbirth_rateis significantly different from zero at \(\alpha=.05\). Report the test statistic, \(p\)-value, and confidence interval.Calculate the correlations among these four variables:
life_exp,birth_rate,infant_mortality, anddeath_rate. Which pair is most strongly related and which pair is most weakly related? (By strength, I mean how far the correlation is from zero, ignoring its sign.) Give a verbal interpretation of the strongest relationship.
✅ Done! Please save and then render your document to an HTML file. Check it over to make sure it is complete (and rendered properly) and then submit it as directed by your instructor. Note that, if any of your code chunks has an error in it, the HTML file will not render properly (this is why removing scratch work is important).